Facebook Page Analytics
Facebook Insights has helped us determine the tastes and
interests of our customer demographics.


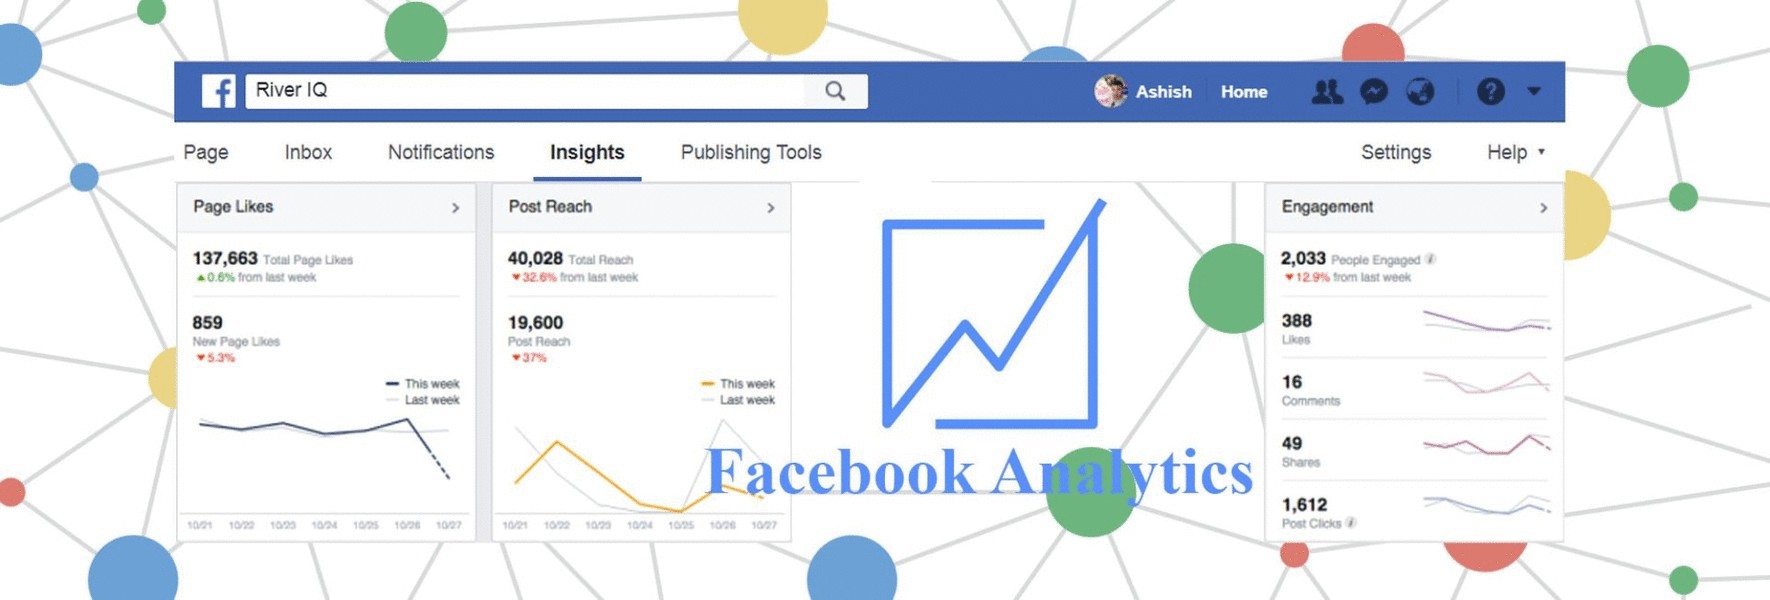
Overview
This section provides a snapshot of the last seven days of
your Pages performance. It focuses on 3 core areas:
·
Page Likes: Total and new likes for your Page
·
Post Reach: Total number of unique people who
were shown your Page and posts
·
Engagement: Total number of unique people who
engaged with your Page, as well as different engagement types
Likes
In
the Likes section you will see 3 core metrics:
·
Page Likes: The total Page likes for each day,
over a 28-day period
·
Net Likes: The number of new likes minus the
number of unlikes
·
Where Your Page Likes Happened: The number of
times your Page was liked, broken down by where it happened
Reach
The
Reach section shows you:
·
Post Reach: The number of people your post was
served to, broken down by paid and organic reach
·
Likes, comments and shares: The positive
engagement that helps you reach more people
·
Hide, Report as Spam and Unlike: Negative
engagement will decrease the number of people you reach
·
Total Reach: The number of people who were
served any activity from your Page
Visits
Under
Visits you will see:
·
Page and Tab Visits: The number of times each of
your Page tabs was viewed
·
External Referrers: The number of times people
came to your Page from a website off of Facebook
Posts
The
Posts tab is divided into the following 3 sections:
·
When Your Fans Are Online: Shows you when the
people who like your Page are on Facebook content
·
Posts Type: Displays the success of different
post types based on average reach and engagement
·
Top Posts from Pages You Watch: Gives you the
engagement of posts from the Pages you're watching
Video
The Videos section will show you 3 things:
·
Video Views: Number of times your Page's videos
were viewed for 3 seconds or more
·
30-Second Views: Number of times your Page's
videos were viewed for 30 seconds or more. If a video is less than 30 seconds,
this counts when people view 97 percent of it.
·
Top Videos: Most viewed videos on your Page
watched for 3 seconds or more.
Events
The People tab is divided into Your
Fans, People Reached and People Engaged.
·
Your Fans: View the gender, age, location and
language of the people who like your Page
·
People Reached: See the people your post was
served to in the past 28 days
·
People Engaged: Find out who has liked,
commented on, shared your posts or engaged with your Page in the past 28 days.
Once you know who your most engaged audience is, you can better tailor your
Boosted Posts to them.
How to download data from Facebook Insights.
Step 1

Go to Facebook Insights, and click on “Export
Data” on the top right of your page.
Step 2

When you see a small box like the above pop
up, choose between page, post, and video data.
Step 3

Now, select a date range for the data. You
will need to choose this based on how often you look at and report the
data on your page.
Step 4

Next, choose a file format. If you have no
preference or idea what to choose, leave the option as “Excel (.xls)”. That’s
what I normally do.
Step 5


Facebook Insight Extract:
Data Sheets:
·
Key Metrics
·
Daily Like Source
·
Daily Total frequency distri...
·
Weekly Total frequency distr...
·
28 Days Total frequency dist...
0 Comments
Be first to comment on this post.